Bank Marketing: Analyze Your Sales Funnel for Free with this Tool

Do your sales seem stuck, and you don’t know why? It’s time to analyze your sales funnel. Sounds hard, but we’ll make it easy.
And it’s SO worth it. You can truly reinvigorate sales with a close look at your sales funnel.
If you’re a little fuzzy on the key steps of a sales funnel, don’t worry. Begin with our blog post Sales Funnel 101, and then jump back to this article to take things to the next level.
STEPS OF THE SALES FUNNEL
For this analysis, we’ll use a 5 step sales funnel:
- Awareness
- Acquisition
- Activation
- Revenue
- Retention
SALES FUNNEL PINCH POINTS
It’s natural to expect people to drop off as they move to the next step. Not everyone who comes to your site will fill out an application. But the key is to look for severe pinch points in your funnel. If you’re doing a great job of acquiring users to your site, but hardly any are going any deeper, you’ve just identified a pinch point. Once you correct that obstacle, all the steps below it will see higher numbers too!
So now, it’s all about identifying those pinch points. All that takes is a little organization. And we’re about to make that very easy for you (for free, incidentally).

DOWNLOAD THE FREE SALES FUNNEL TOOL
Click here to download the free tool to help you analyze your sales funnel flow. (Microsoft Excel required to use).
ANALYZING YOUR SALES FUNNEL
Whether it’s your weight, the speed you drive, or your sales funnel, you can’t control something without measuring it first.
So we’ve put together an AWESOME spreadsheet you can use to quickly identify where your sales funnel is flowing richly, and where it’s being choked by a pinch point. The document is a free download from here (just share your contact info so we know who stopped by).
HOW TO USE THE TOOL
The Sales Funnel Tool allows you to enter your own data for the first 5 stages of your sales funnel. Then, it automatically calculates the flow from one step to the next to help you visualize how you’re doing.
STEP 1: AWARENESS
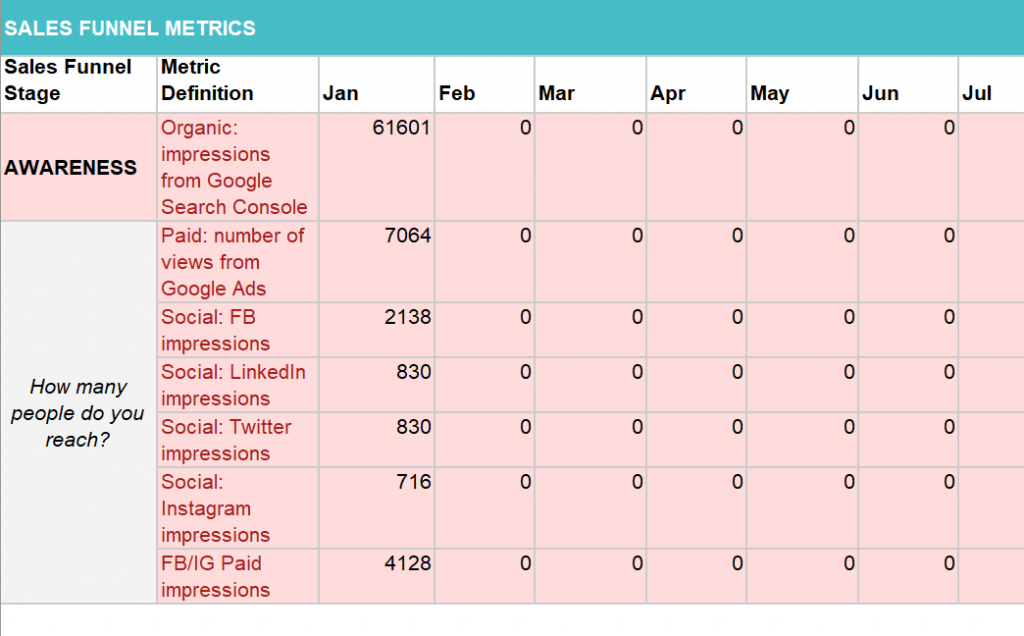
Begin using the Sales Funnel Tool by entering the number of people who have seen your messaging month by month.
- The number who saw you in their Google search results (you can find that data from Google Search Console)
- The number who saw your Google and social media ads (the number of impressions in your Google ad campaign)
- The number who saw your social media profile or posts
These monthly numbers are kind of spread out among Google and Facebook primarily, but just open your various metric sources in different browser tabs for quick reference and you should be able to add your monthly numbers fairly quickly.
You now know how many people had an impression of your brand. So how many of those did you actually acquire?

Awareness: Begin by tracking how many people were exposed to your brand.
STEP 2: ACQUISITION
In the Acquisition portion of the Sales Funnel Tool, record the UNIQUE PAGE VIEWS of your website. If you also track incoming phone calls of a dedicated marketing number, there’s a place to add that data as well, month by month.
So far, folks have seen your brand and come for a visit. Next, let’s record how many actively engaged with you.

Acquisition: Web traffic numbers reveal how many moved to the Acquisition stage.
STEP 3: ACTIVATION
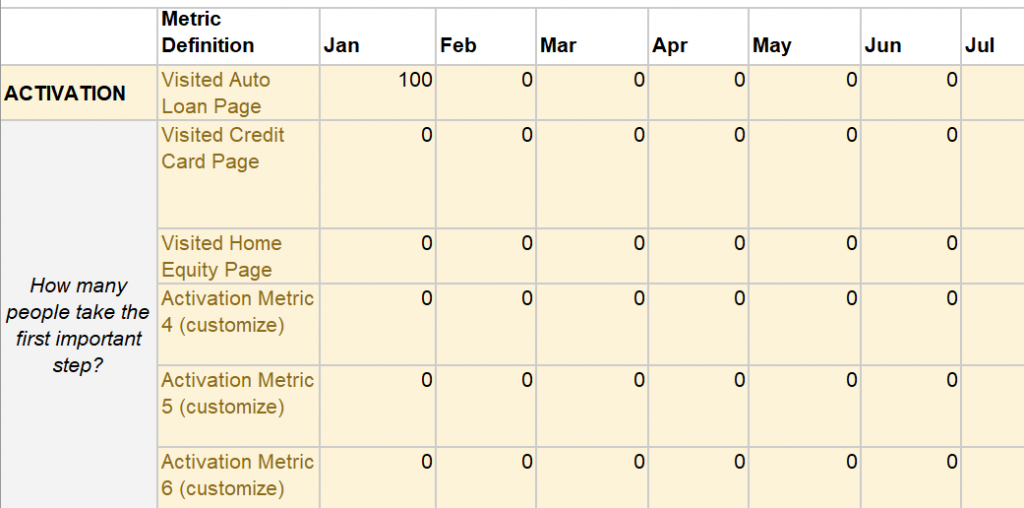
Identify pages on your site that indicate a user who’s actively shopping. These could be application pages or landing pages about your profit centers. Feel free to customize the labels for those rows.
Then, enter the monthly traffic for each of those pages. Voila! You’re now ready to see how many of these folks have actually converted!

Activation: Dig into individual page traffic to track the level of activation.
STEP 4: REVENUE
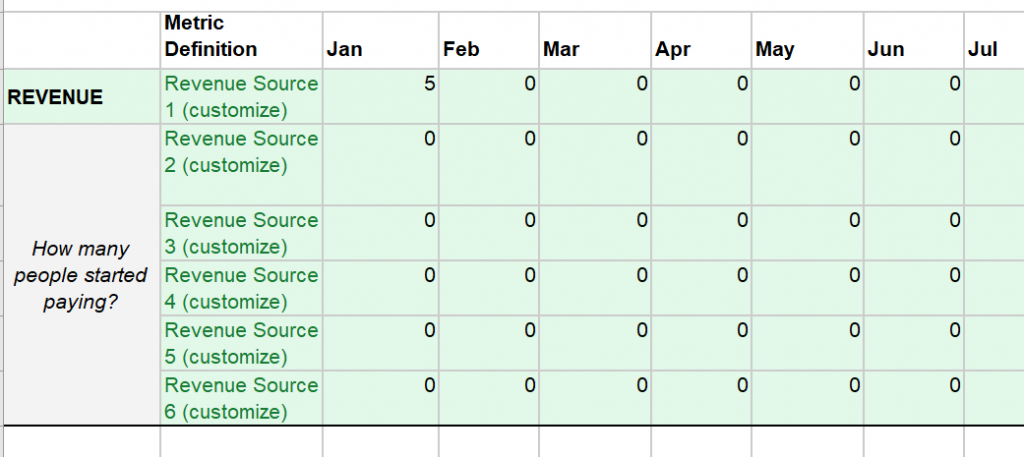
Identify the key metrics you consider revenue, and label the rows of the tool accordingly. They could be new accounts opened or new loans on the books. It’s really up to you. Enter the number of conversions for each, month by month. To be clear, you should track the number of sales, not the revenue from the sales. We’re tracking people here. So 10 auto loans valued at $150,000 would be 10, not 150,000.

Revenue: How many sales resulted? Look for the number of sales, not the amount of revenue. We’re tracking people here.
STEP 5: RETENTION (OPTIONAL)
If you track the value of each of your depositors, you may have the ability to enter data showing repeat business. If not, don’t worry. Just improving your sales funnel to the Revenue stage is a big step up for most folks!

Retention: Add on sales can be hard to quantify, but SO nice to have!
THE ANALYSIS
Scroll down the tool to STEP TWO and you’ll see a breakdown of how your customers are flowing through your funnel.
We put in some fictitious numbers to demonstrate.
10,000 people saw an impression of your brand in January, 1,000 came to your site, 25 engaged deeper, 2 converted and 1 increased the products used.
But it’s the next column that’s more important. It shows the percentage that moved on to the next step of your funnel.
- 10% advanced from Awareness to Acquisition
- 2.5% advanced from Acquisition to Activation
- 8% advanced from Activation to Revenue
- 50% advanced from Revenue to Retention (wouldn’t that be nice!?)
We’ve just identified a pinch point. Do you see it?

Analysis: The tool’s calculations reveal a pinch point!
ATTACK THE LOWEST NUMBER
Just look for the lowest number. In this case, it’s the 2.5% that moved from Acquisition to Activation. For some reason, people in this example are coming to the website, but not doing much else. Problem identified!
The numbers beyond that pinch point are excellent. Just imagine the impact if you fixed the pinch point and delivered twice as many people to the rest of your sales funnel!
Enjoy the Sales Funnel Tool and let us know the results you see! We love to hear success stories!
Share This Post
Do You Want To Boost Your Business?
See how easy it can be to add the force of video to your marketing strategy

